
Ethereum price forms bullish flag as ETH ETF inflows rise

Ethereum  eth-5.07% token was trading at $3,895 on Nov. 2, up by 178% from its lowest level this year. It has formed a bullish flag pattern, pointing to more gains as exchange-traded funds inflows rise.
Data compiled by SoSoValue shows that spot Ethereum ETFs outperformed Bitcoin  btc-3.23% last week. These funds added over $114 million in inflows
Ethereum price technical analysis
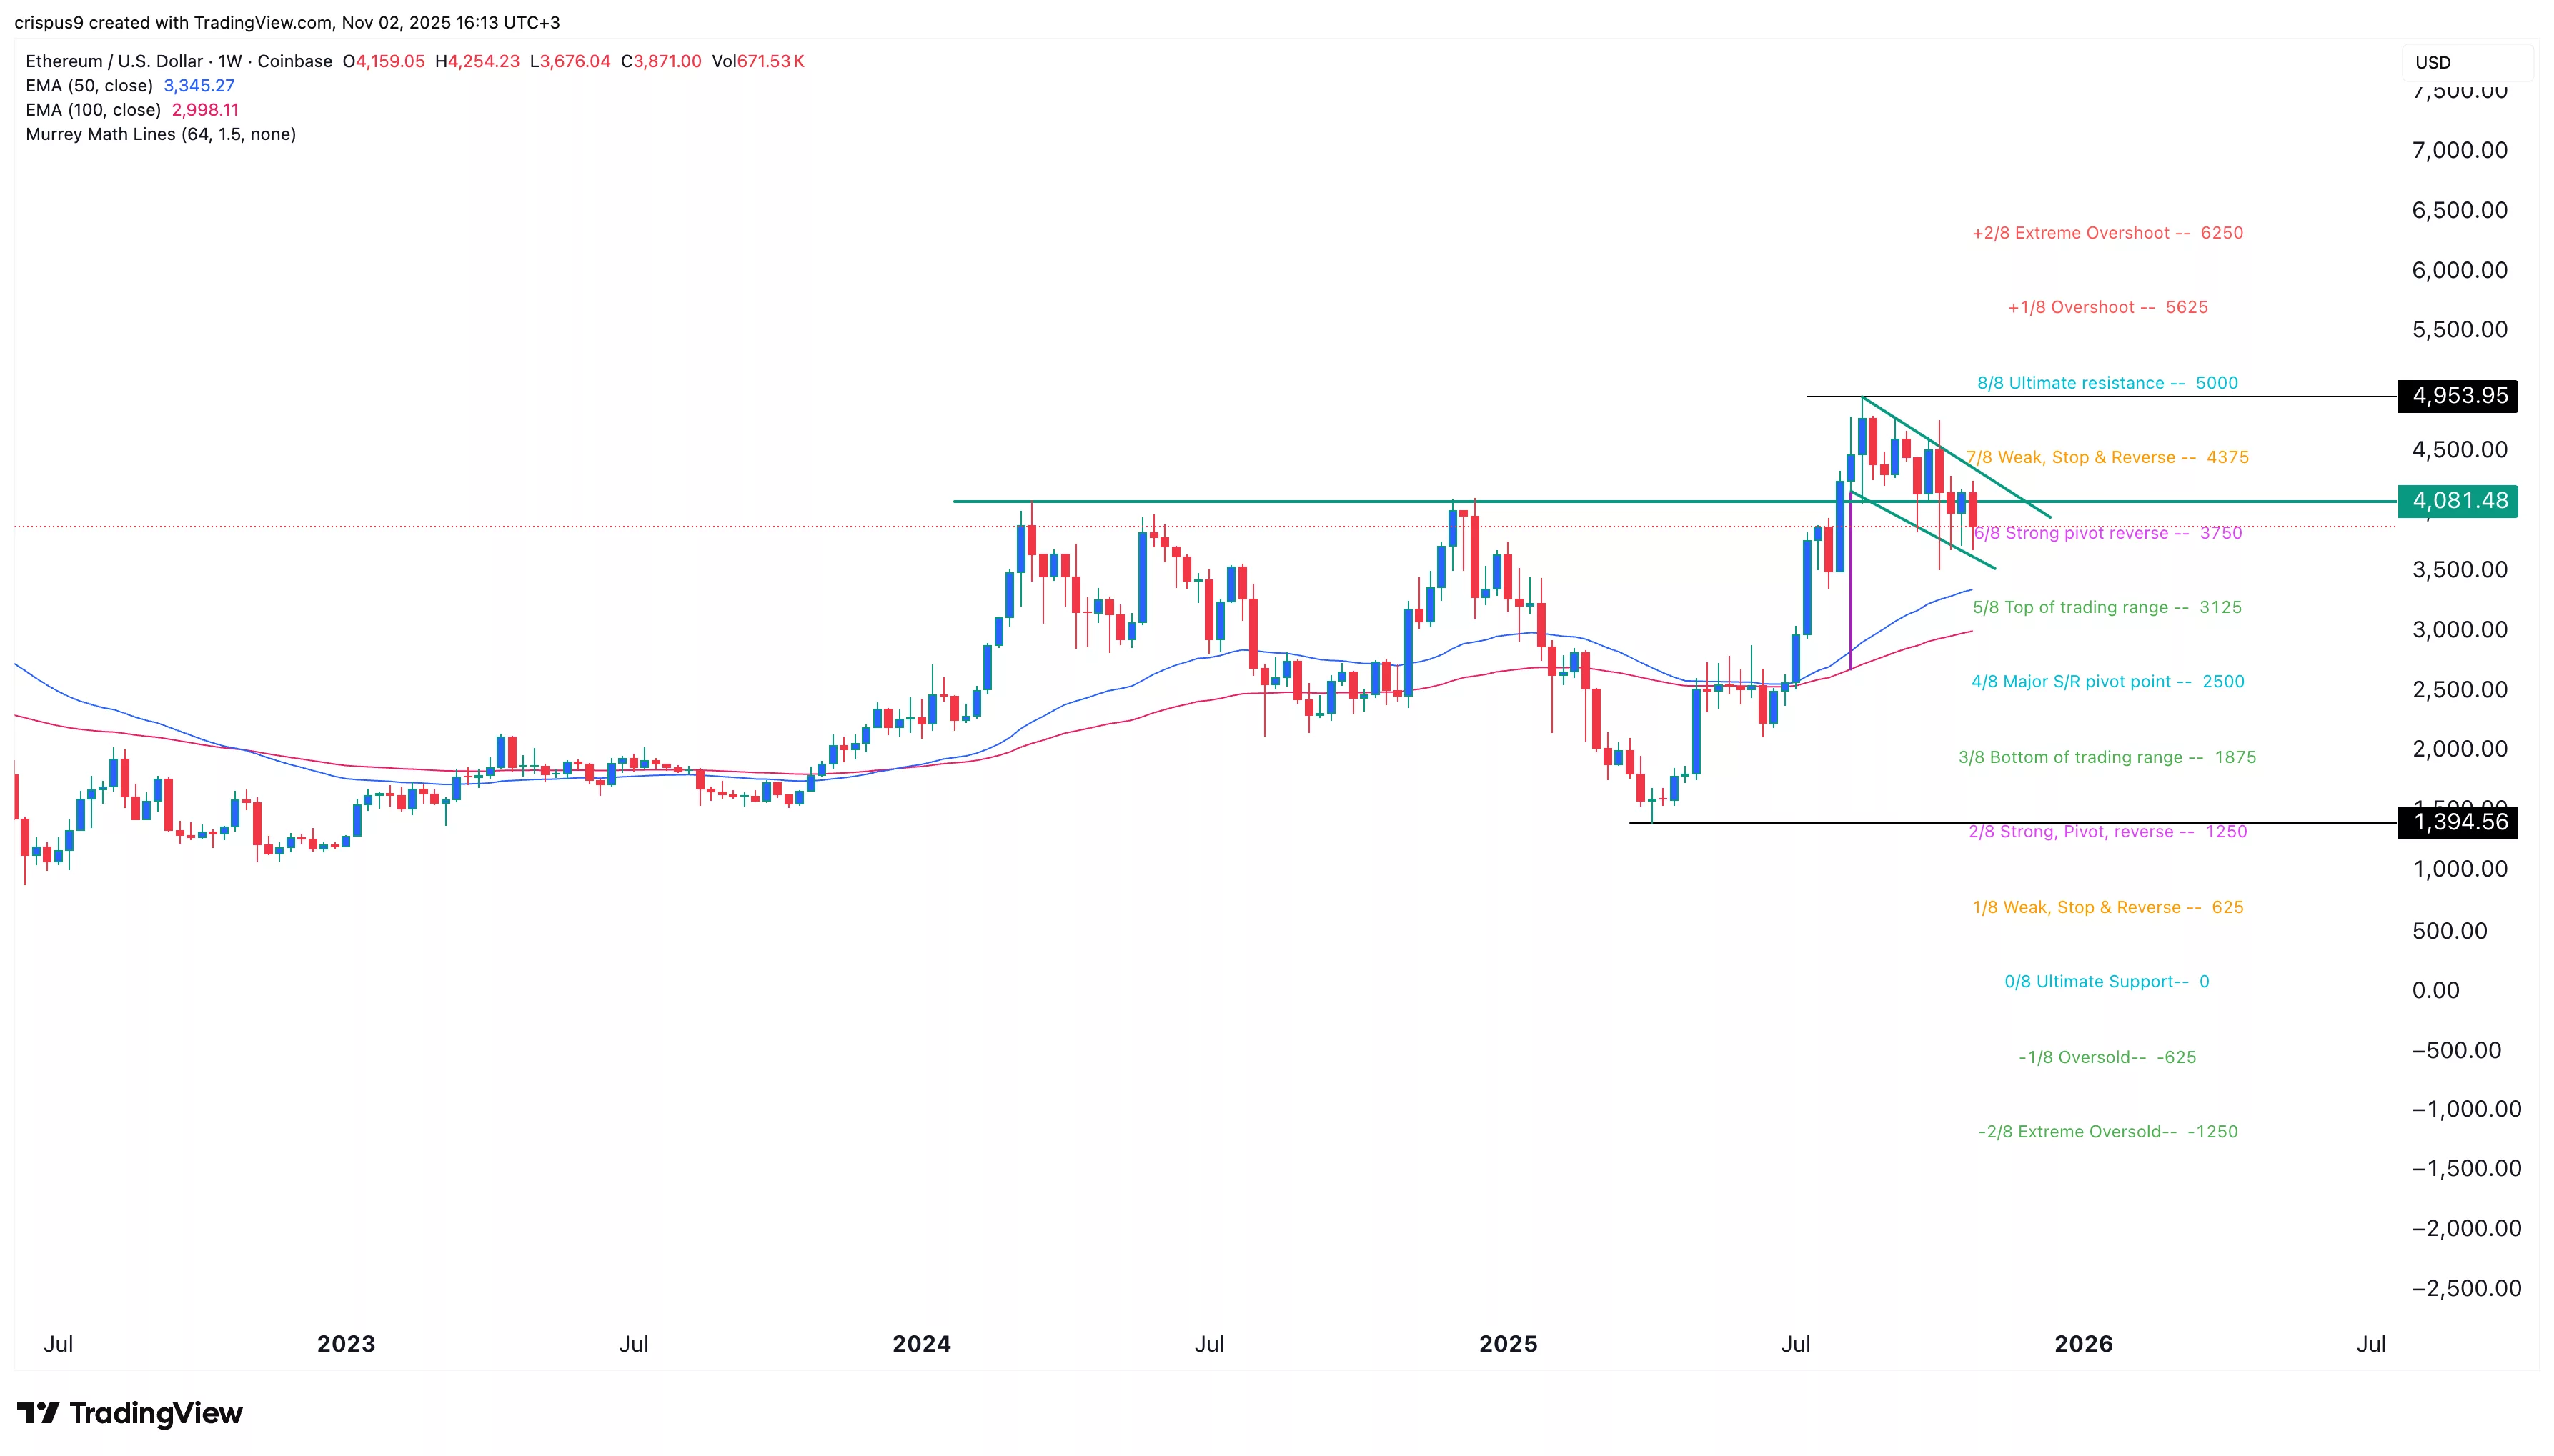
The weekly chart shows that the ETH price has rebounded from a low of $1,394 in April to a high of $4,953 in September. It has remained above the 50-week and 100-week Exponential Moving Averages, which formed a bullish crossover in June.
ETH’s price is also in the second phase of the Elliot Wave pattern, followed by the bullish third phase.
Ethereum price has also formed a bullish flag pattern, which is made up of a vertical line and a descending channel. It also retested the critical support level at $4,080, the highest point in March and December last year.
Therefore, the most likely scenario is a rebound, potentially to the ultimate resistance of the Murrey Math Lines at $5,000.


No comments